n8n
Description
n8n is a low-code workflow automation platform that allows you to automate processes for a multitude of purposes. It integrates with different apps, APIs, as well as AI.
Automation tech stack deployment
Before diving into n8n, here's my working Docker automation stack:
- n8n (core orchestration)
- ntfy (notifications)
- LoggiFly with a dedicated Docker socket proxy container (secure container log monitoring)
- Ollama (local LLMs)
- Open WebUI (Ollama GUI)
All services run on a dedicated automation-stack Docker network. Everything is set up in the following Docker Compose YAML file with an accompanying .env file below it:
docker-compose.yml
services:
  n8n:
    image: n8nio/n8n
    container_name: n8n
    ports:
      - "5678:5678"
    environment:
      - N8N_BASIC_AUTH_ACTIVE=true
      - N8N_BASIC_AUTH_USER=${N8N_USER}
      - N8N_BASIC_AUTH_PASSWORD=${N8N_PW}
      - WEBHOOK_URL=${N8N_URL}              # Crucial for OAuth2 redirect URIs
      - N8N_PROXY_HOPS=1                    # Accounts for hop from Nginx Proxy Manager
    volumes:
      - ./n8n:/home/node/.n8n
    networks:
      - automation-stack

  ollama:
    image: ollama/ollama:latest
    container_name: ollama
    environment:
      # Raspberry Pi Optimizations
      - OLLAMA_MAX_QUEUE=512
      - OLLAMA_NUM_PARALLEL=1
      - OLLAMA_MAX_LOADED_MODELS=1
      - OLLAMA_KEEP_ALIVE=2m
      - OLLAMA_MAX_VRAM=2GB
      - OLLAMA_FLASH_ATTENTION=1
    ports:
      - "11434:11434" # Ollama API port
    volumes:
      - ollama_data:/root/.ollama
    restart: unless-stopped
    networks:
      - automation-stack

  open-webui:
    image: ghcr.io/open-webui/open-webui:main
    container_name: open-webui
    ports:
      - "3020:8080" # Open Web UI port
    environment:
      - OLLAMA_API_BASE_URL=http://ollama:11434
    depends_on:
      - ollama
    restart: unless-stopped
    networks:
      - automation-stack

  ntfy:
    image: binwiederhier/ntfy
    container_name: ntfy
    command:
      - serve
    environment:
      - TZ=${TZ}
    user: 1000:1000 # optional: replace with your own user/group or uid/gid
    volumes:
      - ./ntfy/ntfy/cache/ntfy:/var/cache/ntfy
      - ./ntfy/ntfy/config:/etc/ntfy
      - ./ntfy/ntfy/db:/var/lib/ntfy
      - ./ntfy/ntfy/letsencrypt:/etc/letsencrypt/live/${NTFY_FQDN}
    ports:
      - 8015:80
      - 9015:443
    healthcheck: # optional: remember to adapt the host:port to your environment
        test: ["CMD-SHELL", "wget -q --tries=1 http://localhost:80/v1/health -O - | grep -Eo '\"healthy\"\\s*:\\s*true' || exit 1"]
        interval: 60s
        timeout: 10s
        retries: 3
        start_period: 40s
    restart: unless-stopped
    init: true # needed, if healthcheck is used. Prevents zombie processes
    networks:
      - automation-stack

  loggifly:
    image: ghcr.io/clemcer/loggifly:latest
    container_name: loggifly
    # It is recommended to set the user so that the container does not run as root
    user: 1000:1000
    read_only: true
    environment:
      TZ: ${TZ}
    volumes:
      - socket-proxy:/var/run
      # Place your config.yaml here if you are using one
      - ./ntfy/loggifly/config/config.yaml:/app/config.yaml
    depends_on:
      - loggifly-socket-proxy
    restart: unless-stopped
    networks:
      - automation-stack

  loggifly-socket-proxy:
    container_name: loggifly-socket-proxy
    image: "11notes/socket-proxy:2"
    read_only: true
    # Make sure to use the same UID/GID as the owner of your docker socket.
    # You can check with: `ls -n /var/run/docker.sock`
    user: "0:984"
    volumes:
      - "/run/docker.sock:/run/docker.sock:ro"
      - "socket-proxy:/run/proxy"
    restart: "always"
    networks:
      - automation-stack

volumes:
  ollama_data:
  socket-proxy:

networks:
  automation-stack:
    driver: bridge
    ipam:
      config:
        - subnet: 172.31.0.0/16
N8N_USER=username
N8N_PW='password'
N8N_URL='https://n8n.ts.mydomain.com'

NTFY_FQDN='*.ts.mydomain.com'

TZ=America/New_York
Wazuh Hybrid SOAR
Context
I had initially been exposed to the CrowdStrike Falcon SOAR at my internship, but I no longer have access to this tool. Since I had n8n and Wazuh set up in my homelab, I was motivated to create some kind of pseudo-Falcon SOAR project so I can get more in-depth hands-on experience with SOAR.
Credit
I want to give credit to Mariskarthick M. and Rajneesh G. for providing the SOC workflows for free on n8n.io, and eaglefin for providing documentation on how to configure a custom n8n webhook integration in Wazuh. These formed my foundation, as I then customized the workflows to suit my needs.
n8n workflow
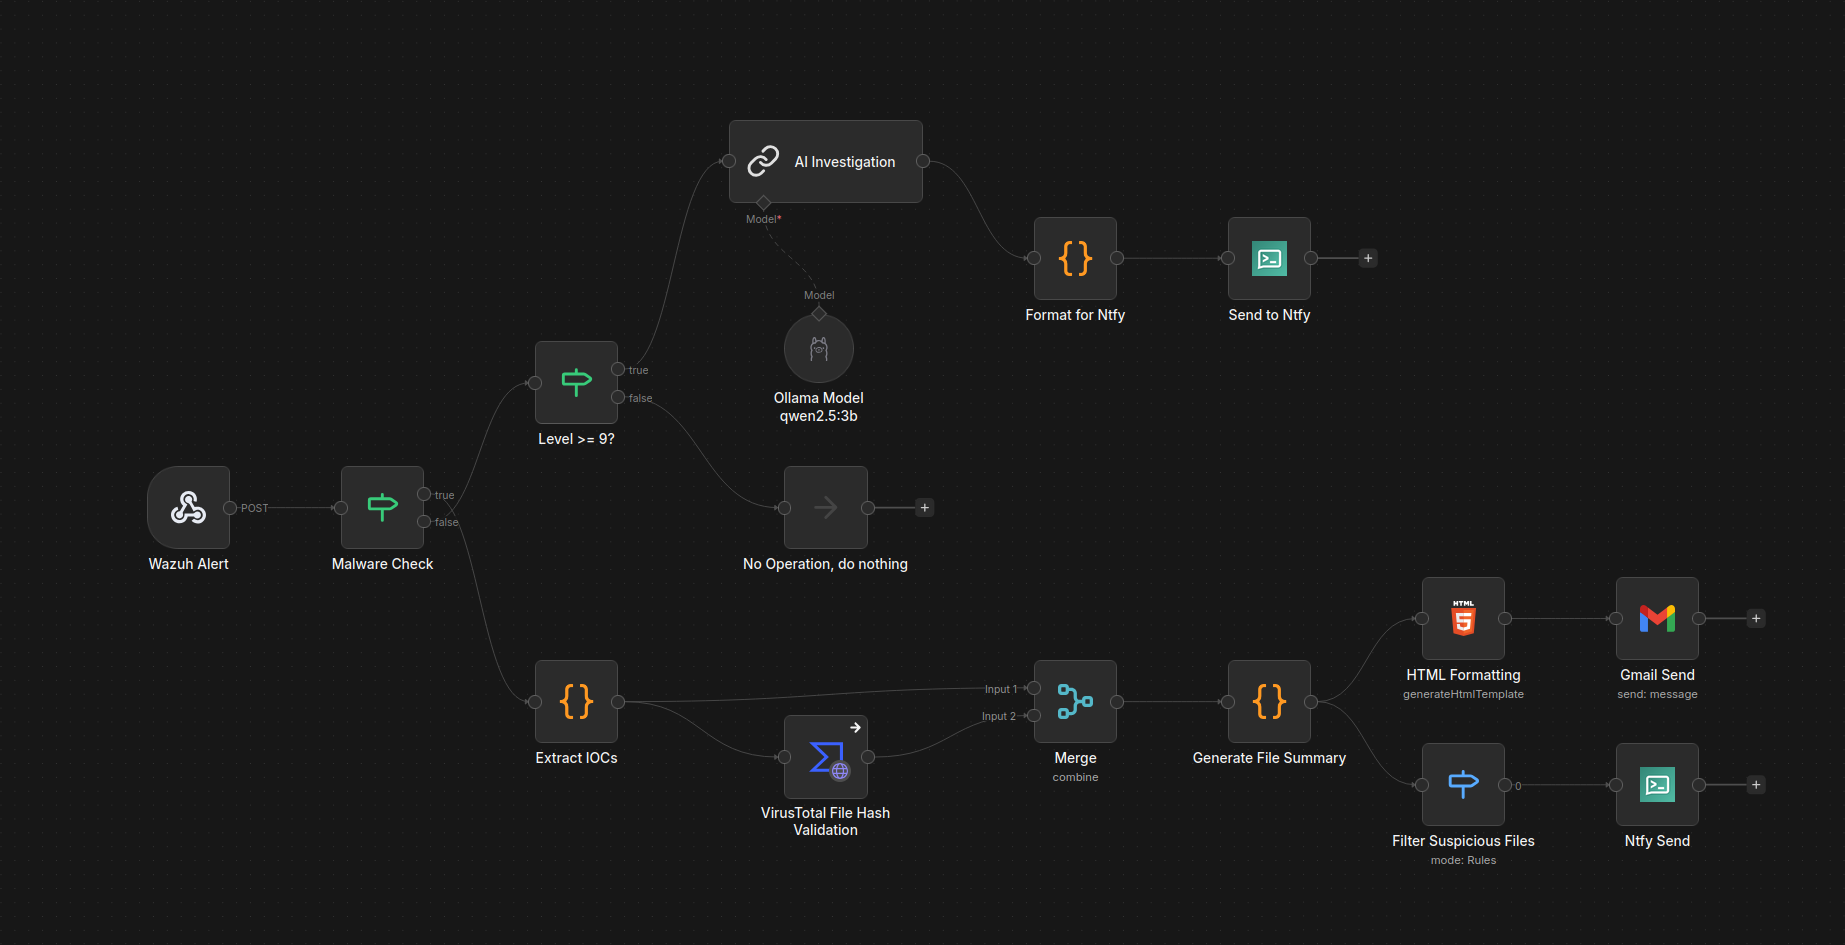
View/download the workflow JSON here
Wazuh Alert stage
For Wazuh to send alerts to n8n, I added a custom integration to Wazuh server's ossec.conf file:
<ossec_config>
  <integration>
    <name>custom-n8n</name>
    <hook_url>https://n8n.ts.mydomain.com/webhook/5eadf22f1e1ed404167ff9b2</hook_url>
    <level>9</level>
    <alert_format>json</alert_format>
  </integration>
</ossec_config>
I also configured File Integrity Monitoring for the Wazuh server and agent's home directory, as well as the server's VirusTotal integration their respective ossec.conf files:
<ossec_config>

  <!-- File integrity monitoring -->
  <syscheck>
    <disabled>no</disabled>

    <directories check_all="yes" realtime="yes">/home</directories>

  <!-- VirusTotal integration (place in server ossec.conf) -->
   <integration>
     <name>virustotal</name>
     <api_key>API_KEY</api_key>
     <group>syscheck</group>
     <alert_format>json</alert_format>
   </integration>

</ossec_config>
Where 5eadf22f1e1ed404167ff9b2 is a randomly generated webhook Path:
The custom-n8n integration depends on the accompanying shell and Python scripts in the Wazuh integrations directory:
(credit: eaglefin)
#!/bin/sh
# /var/ossec/integrations/custom-n8n

WPYTHON_BIN="framework/python/bin/python3"  # Wazuhs eingebettetes Python

SCRIPT_PATH_NAME="$0"
DIR_NAME="$(cd "$(dirname "${SCRIPT_PATH_NAME}")"; pwd -P)"
SCRIPT_NAME="$(basename "${SCRIPT_PATH_NAME}")"

case "${DIR_NAME}" in
  */active-response/bin|*/wodles*)
    [ -z "${WAZUH_PATH}" ] && WAZUH_PATH="$(cd "${DIR_NAME}/../.."; pwd)"
    PYTHON_SCRIPT="${DIR_NAME}/${SCRIPT_NAME}.py"
    ;;
  */bin)
    [ -z "${WAZUH_PATH}" ] && WAZUH_PATH="$(cd "${DIR_NAME}/.."; pwd)"
    PYTHON_SCRIPT="${WAZUH_PATH}/framework/scripts/$(echo "${SCRIPT_NAME}" | sed 's/\-/_/g').py"
    ;;
  */integrations)
    [ -z "${WAZUH_PATH}" ] && WAZUH_PATH="$(cd "${DIR_NAME}/.."; pwd)"
    PYTHON_SCRIPT="${DIR_NAME}/${SCRIPT_NAME}.py"
    ;;
esac

exec "${WAZUH_PATH}/${WPYTHON_BIN}" "${PYTHON_SCRIPT}" "$@"
#!/var/ossec/framework/python/bin/python3
# /var/ossec/integrations/custom-n8n.py

import sys, json, requests

def get_path(obj, path):
    """Einfacher Dot-Pfad-Getter: 'rule.mitre.id' -> obj['rule']['mitre']['id']"""
    cur = obj
    for part in path.split('.'):
        if isinstance(cur, dict) and part in cur:
            cur = cur[part]
        else:
            return None
    return cur

def to_scalar(v):
    # n8n-freundlich: Listen zu Komma-Strings
    if isinstance(v, list):
        return ",".join(str(x) for x in v)
    return v

# Args vom Integrator: [1]=alert_file, [2]=user:pass (optional), [3]=hook_url
alert_file = sys.argv[1]
hook_url   = sys.argv[3]

with open(alert_file, "r", encoding="utf-8") as f:
    alert = json.loads(f.read())

# Wunschfelder (du kannst die Liste beliebig erweitern)
wanted_paths = [
    # Quelle/Agent
    "agent.name", "agent.id", "agent.ip",
    # IP/Quelle (je nach Decoder kann srcip unterschiedlich heißen)
    "data.srcip", "data.src_ip", "srcip", "source.ip",
    # Regel & Beschreibung
    "rule.id", "rule.description",
    # MITRE
    "rule.mitre.id", "rule.mitre.technique", "rule.mitre.tactic",
]

fields = {}
for p in wanted_paths:
    v = get_path(alert, p)
    if v is not None:
        fields[p.replace(".", "_")] = to_scalar(v)

payload = {
    "alert": alert,   # vollständiges Original-Alert für spätere Analysen in n8n
    "fields": fields  # flache, gut weiterverarbeitbare Teilmenge
}

resp = requests.post(hook_url, json=payload, timeout=10)
resp.raise_for_status()
The shell script acts as a wrapper, providing context for the Python script to construct a payload with the full alert, then POSTs it to the n8n webhook URL.
Now, all high-severity alerts with a rule level greater than or equal to 9 will be sent to n8n via the webhook URL.
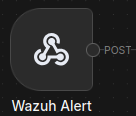
Malware Check stage
Here, the If node is responsible for dual-path routing of events. That is, if the rule ID {{ $json.body.alert.rule.id }} in the payload matches 110002 (Wazuh FIM malware hash alert) or 87105 (VirusTotal integration alert), then this counts as a true condition, passing the flow down the VirusTotal malware investigation pipeline. If false, then the flow is passed up the AI alert triage pipeline.
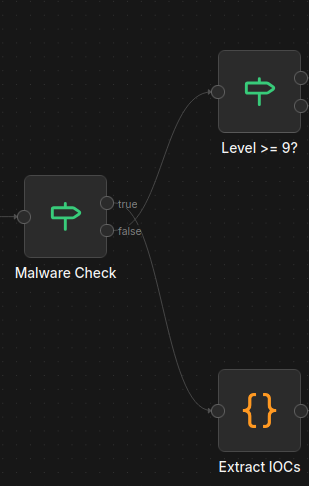
AI triage pipeline
Level Check stage
The first stage of the AI triage pipeline determines again if the alert rule level is greater than or equal to 9. If true, then the information proceeds to be used in AI analysis. If false, then the flow is dropped.
Note
This redundancy prepares for future changes, like sending Wazuh alerts from level 5+ and routing via level-specific n8n pipelines.
AI Investigation stage
In this stage, the alert data and the full log are included in a prompt that is sent over the Docker network to the self-hosted and private Ollama qwen2.5:3b model. This is one of the more optimal LLMs for the Raspberry Pi, and it can be downloaded using the following command:
Here is the prompt, for reference:
You are an experienced SOC AI Analyst. Analyze the following Wazuh security alert
and provide a detailed investigation report.

## ALERT DATA
{{ $json }}

## FULL LOG
{{ $json.full_log }}

## REQUIRED FORMAT

**Alert Name:** [Brief title]

**Alert Description:** [What this alert indicates]

**MITRE ATT&CK:**
- Tactic: [Tactic name and description]
- Technique: [Technique ID and description]

**Impacted Scope:**
- Source IP: {{ $json.data.srcip || 'N/A' }}
- Destination IP: {{ $json.data.dstip || 'N/A' }}
- Host Machine: {{ $json.agent.name }} ({{ $json.agent.ip }})

**External Artifacts Reputation Check:**
[Check reputation of IPs, domains, file hashes if present]

**Analysis:**
[Detailed security analysis - what happened, why it's significant, potential impact]

**Verdict:**
[True Positive / False Positive / Suspicious Activity]

**Security Recommendations:**
1. [Immediate action]
2. [Investigation steps]
3. [Prevention measures]

Provide a clear, organized report with each section on a new line.
As you can see, the prompt resembles a comprehensive security alert triage. On average, the qwen2.5:3b model on the Raspberry Pi 5 takes a minimum of five minutes to deliver a response to this prompt, so obviously this wouldn't cut it in a production environment.
Format for Ntfy stage
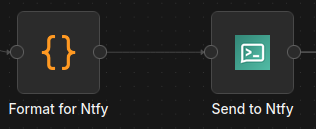
This stage prepares the notification for ntfy. It cleans up the AI response, and removes markdown and other formatting for a clean notification.
Send to Ntfy stage
To set up ntfy, I first configured the config/server.yml file:
# ntfy server config file
#
# Please refer to the documentation at https://ntfy.sh/docs/config/ for details.

base-url: "https://ntfy.ts.mydomain.com"

listen-http: "-"  # Set to :80 to enable HTTP
listen-https: ":443"

# Optional: If connecting over HTTPS
key-file: /etc/letsencrypt/live/*.ts.mydomain.com/privkey1.pem
cert-file: /etc/letsencrypt/live/*.ts.mydomain.com/fullchain1.pem

auth-file: "/var/lib/ntfy/user.db"
auth-default-access: "deny-all"

behind-proxy: true
OPTIONAL: Importing Let's Encrypt TLS certificate/key pair into ntfy
-
Download the certificate/key pair for the domain from Nginx Proxy Manager:

-
Extract the
.ziparchive's contents and copy thefullchain1.pemandprivkey1.pemfiles to the ntfyletsencryptfolder:
I then created an HTTPS reverse proxy host in Nginx for the ntfy server on port 9015 (forwarded to port 443 in the container).
Now, the ntfy server must have the following set up:
- a topic
- a user that can write to the topic
- a user that can read the topic
- an authentication token for the user with write permission
openssl rand -hex 8
# cb8946dad479a9c2          # Random string

# WAZUH-cb8946dad479a9c2    # Add to desired topic name, and copy to clipboard
docker exec -it ntfy sh     # Connect to ntfy terminal

### ntfy sh ###

# 1) Create a write-only user

ntfy user add user_wo

# 2) Grant write-only access to the topic

ntfy access user_wo WAZUH-cb8946dad479a9c2 wo

# 3) Create read-only user

ntfy user add user_ro

# 4) Grant read-only access to the topic

ntfy access user_ro WAZUH-cb8946dad479a9c2 ro

# 5) Generate authentication token for write-only user

ntfy token add user_wo
I then configured the topic, ntfy server URL, and authentication token in the Send to Ntfy node:

Ntfy node parameters
To receive notifications of Wazuh events, I installed the official ntfy app on my Android phone from the Play Store. Once started, I connected to my ntfy server at https://ntfy.ts.mydomain.com and signed in with the read-only user account and password. From there, I subscribed to the WAZUH-cb8946dad479a9c2 topic and was ready to receive notifications.
Result
Once the workflow was published, I ran the following command to test it out:
curl -X POST "https://n8n.ts.mydomain.com/webhook/5eadf22f1e1ed404167ff9b2" \
-H "Content-Type: application/json" \
-d '{
  "agent": {
    "name": "droplet",
    "ip": "192.168.1.100"
  },
  "rule": {
    "id": "5716",
    "level": 11,
    "description": "SSHD authentication failed: password brute force attempt"
  },
  "data": {
    "srcip": "203.0.113.10",
    "dstip": "192.168.1.100",
    "srcport": "54321",
    "dstport": "22",
    "srcuser": "root"
  },
  "full_log": "Failed password for root from 203.0.113.10 port 54321 ssh2"
}'
Which resulted in this notification being sent after five minutes:

Test ntfy notification from Wazuh/n8n

Clicking on a triage alert opens the Wazuh dashboard in a web browser
Below is another example, this time related to system memory:

Wazuh/n8n OOM alert for DigitalOcean VPS
With the Droplet having only 1 GB of RAM, this kind of alert is expected to occur ever so often.
Malware investigation pipeline
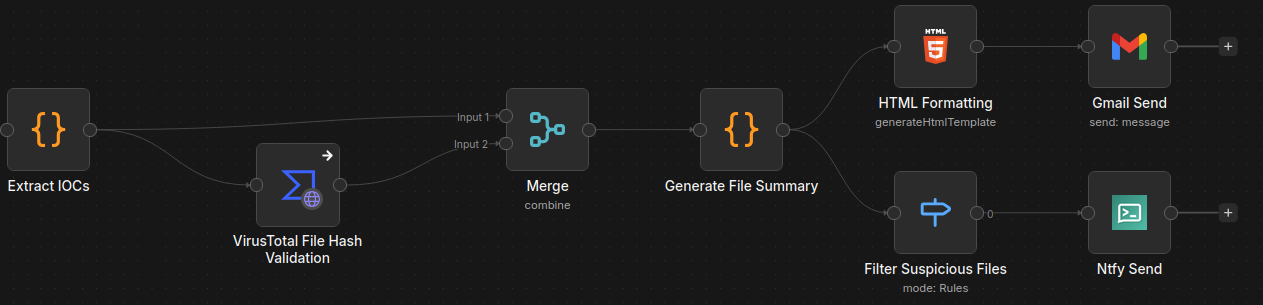
Extract IOCs stage
The malware investigation pipeline begins by receiving the malware alert data and extracts the IOCs (file hashes, filepath, rule level, etc.).
VirusTotal File Hash Validation stage
This information is then passed to the VirusTotal node, which submits the extracted SHA-256 hash value of the malicious file for analysis, using my VT account's public API key.
Merge data stage
As the name suggests, the Merge node combines the data from the Extract IOCs and VirusTotal nodes to be used by the next node in the workflow.
Generate File Summary stage
In this stage, certain data (agent name/IP, rule ID, filepath, etc.) is assigned to variables to be used by the next two nodes.
HTML Formatting -> Gmail Send stages
This formats and stylizes an HTML page that contains information regarding the event, and it makes use of the variables created in the previous stage.
The Gmail Send stage receives this HTML code and uses it as the message that is sent -- thus presenting a stylized HTML page with the malware threat summary in the email itself. I've configured this node with my homelab email as the sender and recipient.
Info
The Gmail Send node requires additional configuration.
Example test run:

Wazuh/n8n malware alert inbox appearance

Wazuh/n8n malware alert email HTML appearance
Filter Suspicious Files -> Ntfy Send stages
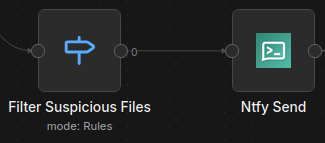
The Filter Suspicious Files stage checks if the VirusTotal summary "Status" is "Suspicious." If it is, then the combined data (IOC data + VT analysis) flows to the ntfy node.
The Ntfy Send stage sends a notification to the ntfy topic with the following formatting:
⚠️ File Threat Detected
🖥️ Agent: {{ $json.summary.AgentName || 'Unknown' }}
IP: {{ $json.summary.AgentIP || 'N/A' }}
🕐 Time: {{ $json.summary.Timestamp || 'Unknown' }}
🧾 File: {{ $json.summary.FilePath || 'Unknown' }}
🧬 SHA256: {{ $json.summary.SHA256.slice(0, 12) }}...
🔍 Status: {{ $json.summary.Status }}
📛 Threat: {{ $json.summary.Description }}
By tapping the notification, the user is redirected to the VirusTotal page of the file's SHA-256 hash value:
Below are two examples of notifications I received after downloading malware from The-MALWARE-Repo (GitHub):

Wazuh/n8n malware alerts via ntfy

Clicking on a malware alert opens its respective VirusTotal hash page in a web browser